Data is everywhere — but having data isn't the same as using it wisely. Businesses often find themselves buried under heaps of information without a clear path forward.
Enter data analytics: not just a buzzword but a structured process that transforms raw data into actionable insights. At Far Reach, we've honed this process, leveraging custom software to guide businesses from data chaos to clarity.
Let's break down each step of this journey.
How does your organization stack up in your data management?
Take our quiz.
How Data Analytics Drive Custom Software
There is no one-size-fits-all in data analytics. This is why we use the process below not as gospel but as a framework we can adjust for each of our clients based on their needs and goals.
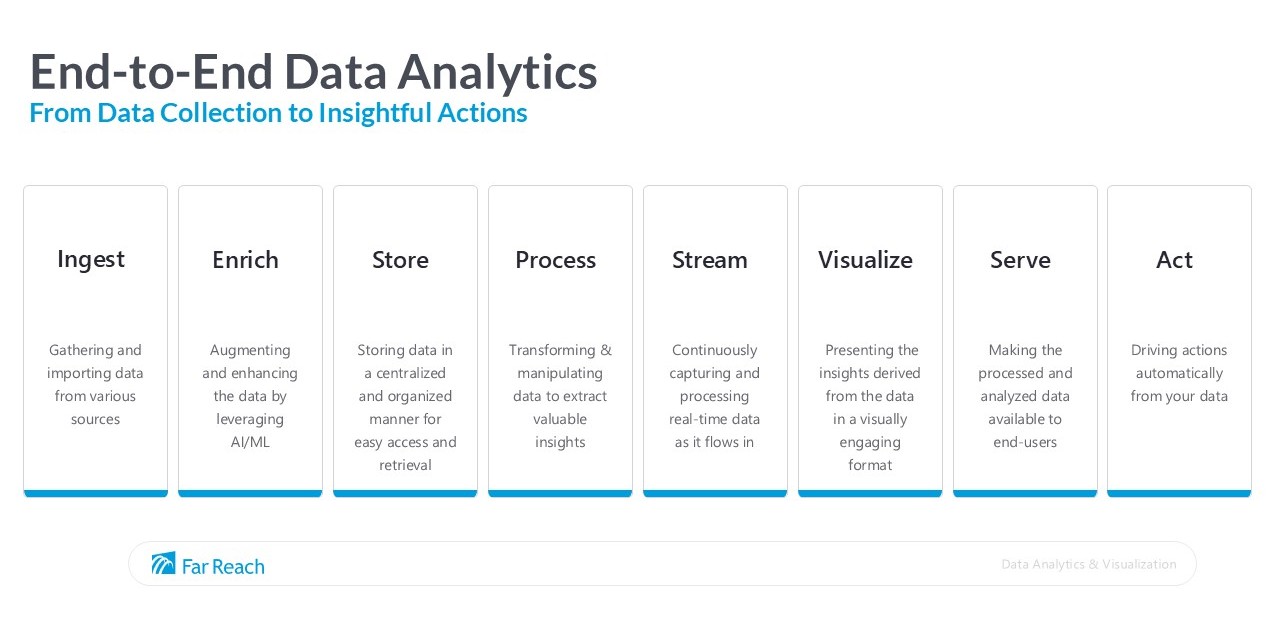
1. Ingest: Gathering the Raw Material
Every data journey begins with ingestion — collecting data from various sources. Whether it’s CRM systems, accounting platforms, or even Excel spreadsheets, this step ensures that all relevant information flows into one central system.
But it's not just about gathering data — it's about doing so efficiently and securely.
Custom software solutions play a critical role here. Off-the-shelf tools often fall short when dealing with unique data sources or specific business requirements. With bespoke software, you can automate data collection, ensuring accuracy and consistency, and setting a strong foundation for the next steps.
2. Enrich: Adding Context and Value
Raw data, by itself, is rarely useful. It needs context — additional information that enriches and elucidates its meaning. This could involve cleaning data, filling in gaps, or combining multiple data sources to provide a fuller picture.
For instance, integrating disparate systems so data stays in sync and reliable. Custom software can automate these processes, applying business-specific rules to ensure that the data is not only accurate but also relevant.
3. Store: Keeping Data Accessible and Secure
Storing data isn’t just about dumping it into a database. It’s about organizing it in a way that makes it easy to access and analyze while ensuring it remains secure.
This is where platforms like Microsoft Fabric come into play by offering scalable solutions tailored to your business needs. Read more about how we use Microsoft Fabric.
Custom software ensures that data storage solutions align with your business workflows. Whether it's setting up data lakes with OneLake or using Synapse Data Engineering for complex data transformations, the right storage strategy supports seamless data access and analysis.
4. Process: Turning Data into Insight
Once data is stored and accessible, it’s time to process it — transforming raw information into meaningful patterns. This could involve statistical analysis, machine learning algorithms, or simple trend identification.
Here’s where the magic happens: With custom software, processing can be fine-tuned to address specific business questions.
Need to predict customer churn? Or identify the most efficient supply chain routes? Tailored algorithms ensure that the insights you derive are directly applicable to your business context.
AI is often involved in this step — here’s how to make sure you’re prepared for using AI.
5. Stream: Real-Time Data, Real-Time Decisions
In many industries, waiting hours or days for data insights isn’t an option. Streaming data processing allows businesses to analyze information as it’s generated, enabling real-time decision-making.
Again, custom software makes this easier. When you own and control your software, you can connect your applications, grant and remove access, and make sure that your data flows seamlessly between your mission-critical apps.
6. Visualize: Making Data Understandable
Data visualization is where complex analytics become comprehensible. It’s one thing to have insights; it’s another to communicate them effectively.
Tools like Power BI excel in this area, but their full potential is unlocked when integrated into a custom software ecosystem tailored to your needs.
Effective visualization helps stakeholders at all levels understand the data’s implications. From interactive dashboards to detailed reports, visual tools turn numbers into narratives that drive decision-making.
Dive deeper into the power of visual data storytelling and see how our clients use data visualization.
7. Serve: Delivering Data where It’s Needed
Processed and visualized data is only valuable if it reaches the right people at the right time. This step involves delivering insights to stakeholders across the organization, often through automated reports or integrated dashboards.
Custom software ensures that data delivery fits seamlessly into your business processes. Whether it’s sending daily sales summaries to managers or providing real-time KPI dashboards to executives and teams, tailored solutions make data accessibility effortless.
8. Act: Driving Business Decisions and Efficiency
The ultimate goal of data analytics is action. Insights should lead to informed decisions that improve efficiency, reduce costs, and/or uncover new opportunities.
But taking action isn’t just about having the right data — it’s about having the right tools to act on it. Custom software bridges the gap between data and action. By integrating analytics directly into your business processes, it enables swift, informed decision-making.
Whether it’s automating marketing campaigns based on customer behavior or optimizing inventory management in real-time, the right software turns insights into outcomes.
Read more about how custom software can help scale your data capabilities
Conclusion: The Far Reach Advantage in Data Analytics
At Far Reach, we understand that data analytics isn’t just a series of steps — it’s a holistic process that requires the right tools and strategies at every stage.
Ready to take control of your data journey? Reach out and find out how we can help.