Far Reach was founded, in part, to create a great place for team members to work. We think a big part of that is being happy at work. Well, how do you know if team members are happy if you’re not tracking it?
Last year we set out to do just that. When we started, we found there were dozens of options for doing so—engagement surveys, monthly feedback, daily questions, and more. In our research, we ran across a concept called the Niko-niko calendar.
We like the Niko-niko concept because:
- Daily feedback reveals issues early
- Metrics are visible to the whole team
- Tracking is quick and easy
- Team members can stop to reflect on their days as a whole
The Niko-niko framework was a great place for us to start, but, as with most things, we had to customize it for our team. Our criteria included:
- Tracking for on-site and remote workers
- Non-invasive
- Visibility for each team
Happiness Metrics V1
Our team uses Hipchat for internal IM, so we decided to start with a platform already ingrained into our workflow. In our first iteration, each team member reported his or her happiness at the end of every day. Members of Team OO reported in the OO Hipchat room, Team GID members reported in the GID Hipchat room, and everyone else reported in the Flex Team room. On a regular basis, we compiled results in a team-wide spreadsheet so we could view trends over time.
We started with three happiness levels: green face, yellow face, and red face.

Early indications of the team’s happiness were positive—green faced, if you will. But you know us; we’re always looking to improve.
Iterating
It became obvious very quickly that people needed a daily reminder to share their happiness, so we implemented automated reminders to be sent through Hipchat at 4:30 each day. I follow up in the morning with anyone who hasn’t shared their previous day’s weather.
The other thing we noticed after a few months of reporting is that people tended to report yellow face most days, unless something really positive or really negative happened. Because of that, we weren’t learning a whole lot, except when extremes happened.
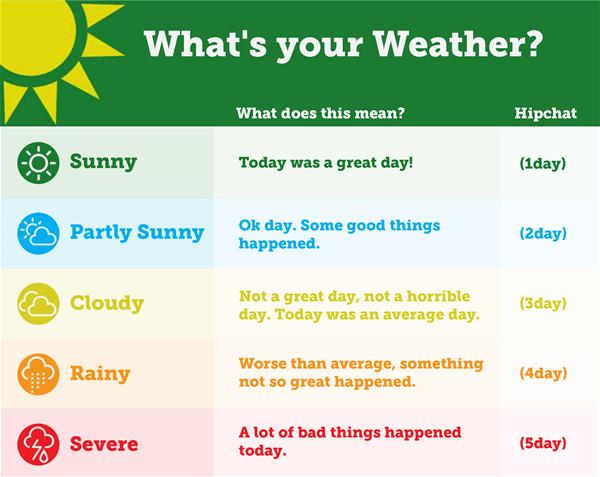
Since everyone was reporting in the middle, we made more middles and expanded to a 5-point scale. While we were at it, we changed from faces to weather, made our own icons, and defined what each level means.

What We’ve Learned So Far
We’ve learned team members get the most value out of knowing their teammates’ weather on a daily basis—the long-term tracking wasn’t as insightful as the day-to-day reporting. Seeing it daily allows us to uncover issues more quickly and take steps to fix the problem before it’s too late.
We’ve also found the daily reflection time to be important. If I had a sunny day, why, and how can I repeat that? On the flip side, if it was severe, why, and what can I (and/or the team) do to prevent more of those? Communicating these insights to the team is helpful as well. I like knowing why team members had a sunny or a stormy day.
Usually something good or bad happens to the whole team, not an individual. Daily team weather tends to trend in a similar direction. Further, we learned that rainy and severe weather days are usually caused by unforeseen issues and blockers—something unplanned or out of our control. We quickly noticed the team coming together to support each other on those days, which is great!
We’re really—no wordplay intended—happy with how we’re tracking team happiness. Of course, we’ll continue to evaluate and iterate on it. We know there is more we can do to help our teams be happy and find meaning in their work and, as we continue to focus on this, we hope the happiness metrics will serve as a guide for what’s working and what’s not.
Do you track your team’s happiness? If so, how?
Reach out and let us know.